Draw 3D Lines and Point
![]() s
s
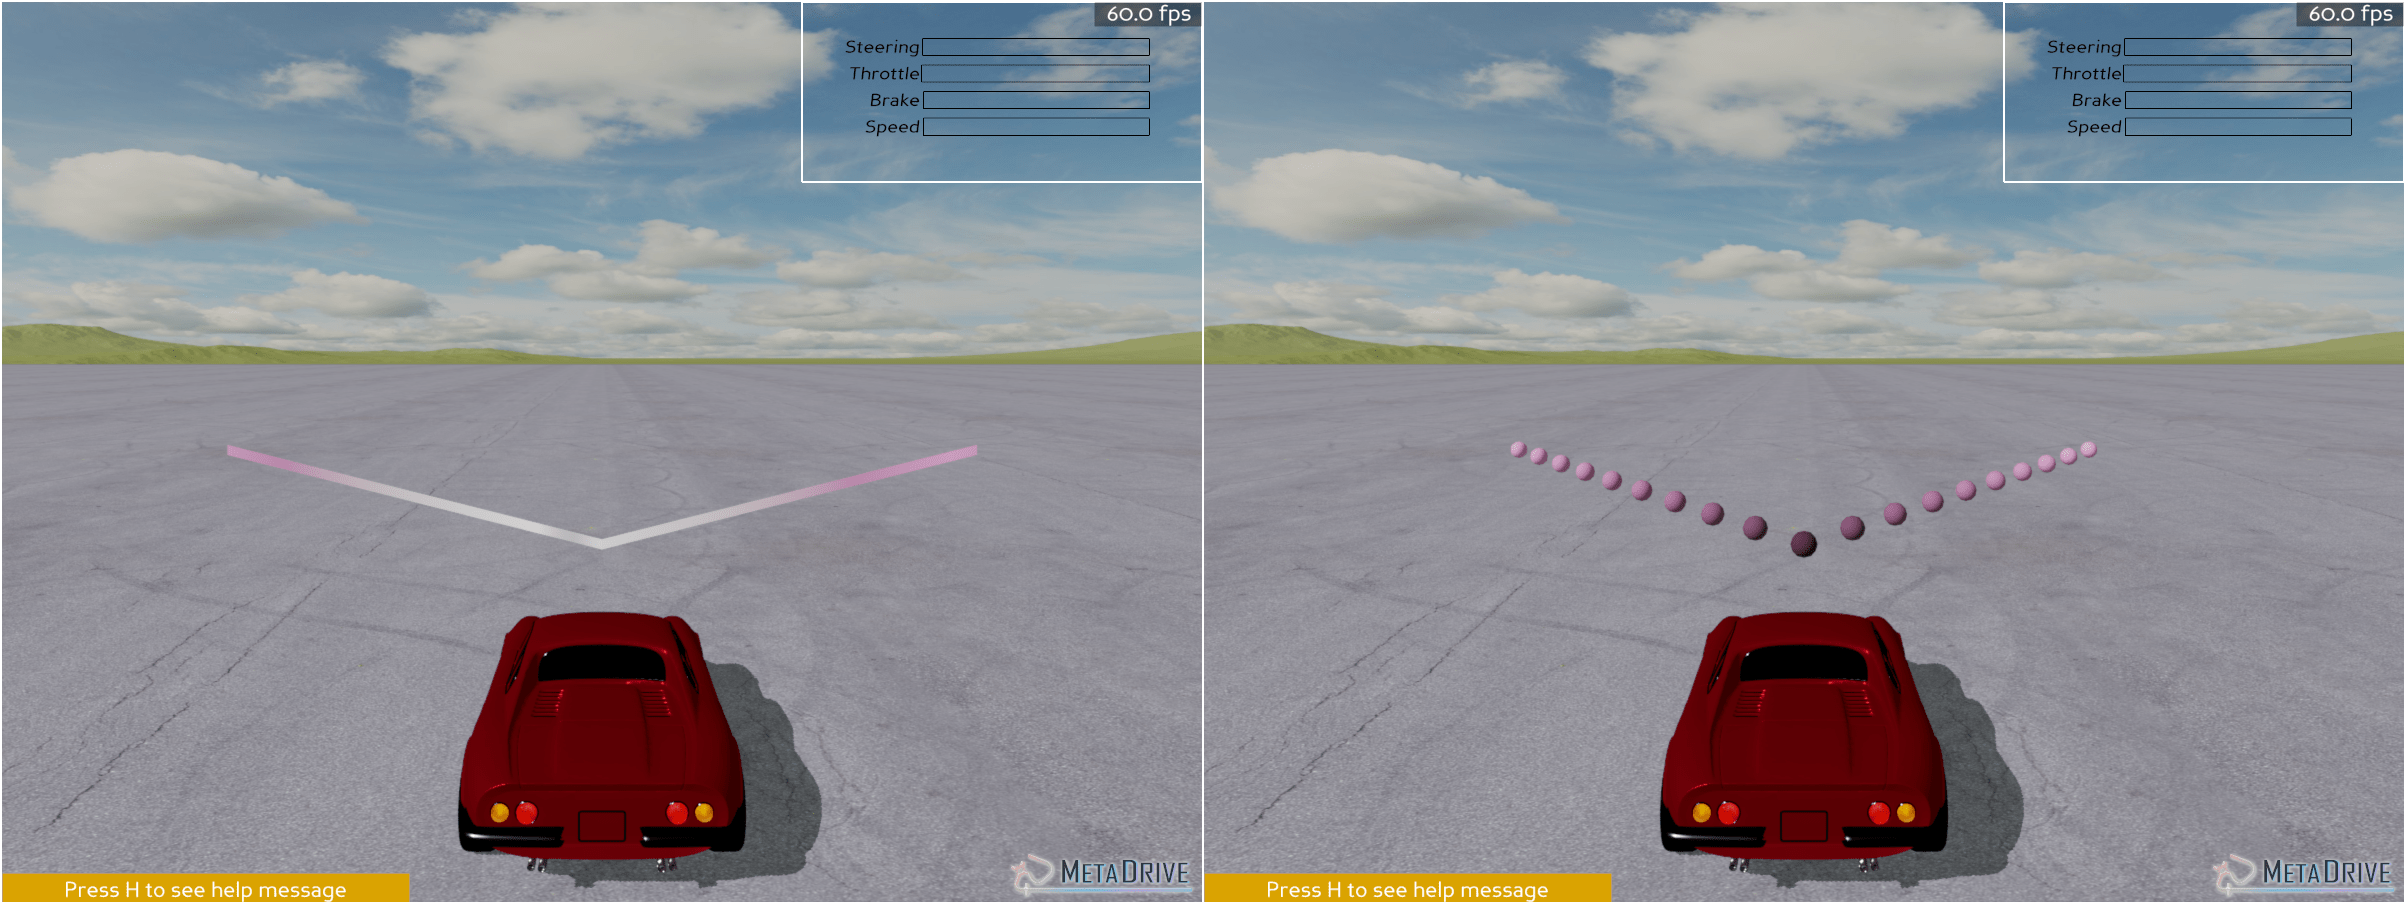
We usually draw points and lines in the 3D world to debug when developing new features and fixing bugs. There are two types of visualization tools can be used: line and point. In this section, we will show how to use these tools. First of all, let’s make an environment and define the tool function which returns a set of points representing a straight line and the color for each point. The points gradually become pink with the distance increasing.
from metadrive.envs.base_env import BaseEnv
import numpy as np
import os
render = not os.getenv('TEST_DOC')

# Define a tool function.
def make_line(x_offset, height, y_dir=1, color=(1,105/255,180/255)):
    points = [(x_offset+x,x*y_dir,height*x/10+height) for x in range(10)]
    colors = [np.clip(np.array([*color,1])*(i+1)/11, 0., 1.0) for i in range(10)]
    if y_dir<0:
        points = points[::-1]
        colors = colors[::-1]
    return points, colors

# create environment
env = BaseEnv(dict(use_render=render))
Lines
The API we are using takes a list of lines as input. A line is represented by a list of points. Thus we create two lines in the following script and draw them in the scene. Also, colors can be specified for each point.
line_1, color_1 = make_line(6, 0.5, 1) # define line 1 for test
line_2, color_2 = make_line(6, 0.5, -1) # define line 2 for test
lines = [line_1, line_2]
colors = [color_1, color_2]

env.reset() # launch the simulation
try:
    drawer = env.engine.make_line_drawer(thickness=5) # create a line drawer
    drawer.draw_lines(lines, colors) # draw lines

    for i in range(100):
        env.step([0,0])
finally:
    env.close()
A drawer can draw as many lines as possible, but sometimes you may want to clear previous lines and recreate new ones. In this case, you can use drawer.reset() to clear previous lines. The following code shows an example, where every step the lines to draw are updated.
env.reset() # launch the simulation
try:
    drawer = env.engine.make_line_drawer(thickness=5) # create a line drawer
    for i in range(100):

        # draw different lines every step
        line_1, color_1 = make_line(6, 0.5, 0.01*i) # define line 1 for test
        line_2, color_2 = make_line(6, 0.5, -0.01*i) # define line 2 for test
        lines = [line_1, line_2]
        colors = [color_1, color_2]
        drawer.reset()
        drawer.draw_lines(lines, colors) # draw lines

        env.step([0,0])
finally:
    env.close()
By default, the drawer drawing lines in the world coordinates. It is also allowed to draw lines in objects’ local coordinates. In the following example, you will see that the two lines moves with the vehicle. Note: there is a bug that when the drawer is set in vehicle coordinates the color parameter is invalid. Thus the line color is white in this example.
env.reset() # launch the simulation
try:
    drawer = env.engine.make_line_drawer(env.agent.origin, thickness=5)
    # rotate the drawer by 90 degree, as +x is at the right side of the car.
    drawer.setH(90)
    for i in range(100):

        # draw different lines every step
        line_1, color_1 = make_line(6, 0.5, 0.01*i) # define line 1 for test
        line_2, color_2 = make_line(6, 0.5, -0.01*i) # define line 2 for test
        lines = [line_1, line_2]
        colors = [color_1, color_2]
        drawer.reset()
        drawer.draw_lines(lines, colors) # draw lines

        env.step([0.1,0.5])
finally:
    env.close()
Points
MetaDrive also provides point drawer to visualize a set of points. The usage of this function is almost the same as the line drawer. The following example creates a point drawer and update the point positions every frame.
env.reset() # launch the simulation
try:
    drawer = env.engine.make_point_drawer(scale=1) # create a point drawer
    for i in range(100):

        # draw different lines every step
        line_1, color_1 = make_line(6, 0.5, 0.01*i) # define line 1 for test
        line_2, color_2 = make_line(6, 0.5, -0.01*i) # define line 2 for test
        points = line_1 + line_2 # create point list
        colors = color_1+ color_2
        drawer.reset()
        drawer.draw_points(points, colors) # draw points

        env.step([0,0])
finally:
    env.close()
In addition, the points can work with lines. In the following example, a list of points are visualized with lines, while the other one is visualized with points. Besides, we cancel the reset to keep previous drawn points and lines.
env.reset() # launch the simulation
try:
    point_drawer = env.engine.make_point_drawer(scale=1) # create a point drawer
    line_drawer = env.engine.make_line_drawer(thickness=5) # create a line drawer
    for i in range(100):

        if i%5==0:
            # draw different lines every step
            line_1, color_1 = make_line(6, 0.5, 0.01*i) # define line 1 for test
            line_2, color_2 = make_line(6, 0.5, -0.01*i) # define line 2 for test
            points = line_1
            point_colors = color_1
            lines = [line_2]
            line_colors = [color_2]
            # drawer.reset()
            point_drawer.draw_points(points, point_colors) # draw lines
            line_drawer.draw_lines(lines, line_colors)

        env.step([0,0])
finally:
    env.close()